Australia can’t stop talking about how few homes it’s building. So it’s worth pointing at the one part of the country quietly doing the opposite — the sandy fringe of Perth, where the cranes and house-frames haven’t stopped for years and the approvals data has exploded.
Take Wanneroo, the sprawling council on Perth’s northern edge. Wanneroo recorded 3,971 dwelling approvals in the 12 months to May 2026, compared with 1,304 in 2020 — a jump of 205%. At an average of about 2.5 residents per dwelling, a single year of that is housing for roughly 9,900 people — close to a whole town the size of Esperance, conjured out of coastal scrub and appearing on the city’s northern edge, year after year.
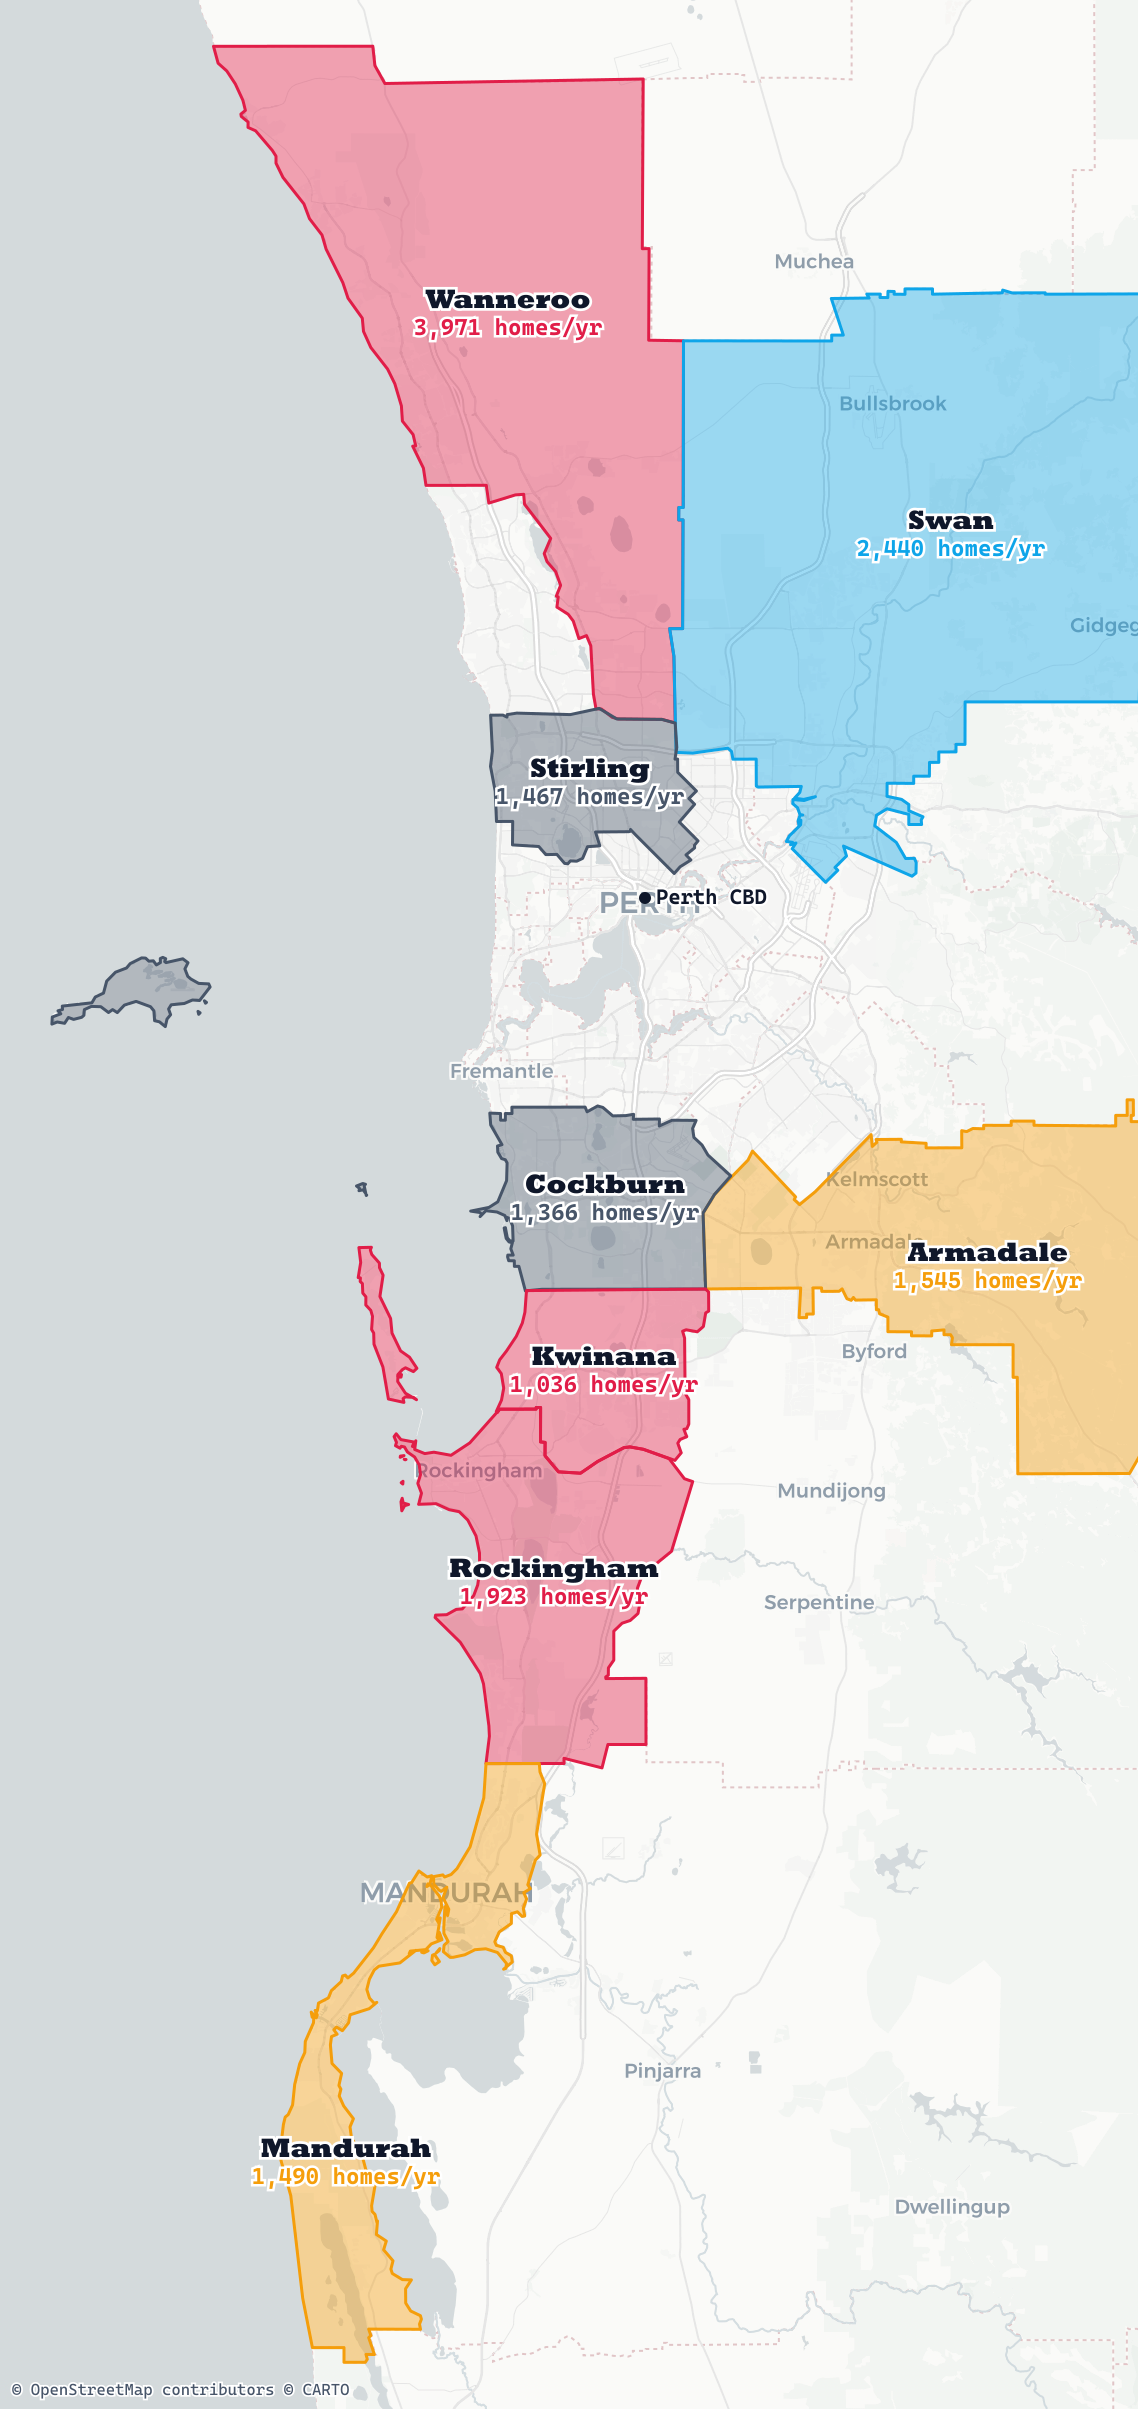
Shading = growth in annual dwelling approvals vs each council’s first year on record. Council boundaries: ABS ASGS 2021. Basemap: © OpenStreetMap contributors © CARTO.
And it isn’t one runaway council. The whole growth corridor is surging together — the eight busiest WA councils approved around 15,238 dwellings between them in a single year. The biggest percentage jumps are clustered in the outer south — places like Rockingham (+236%), Mandurah (+175%), Kwinana (+215%) — where paddocks are turning into full-blown suburbs at a pace the eastern capitals can only dream about.
Each line is a council’s dwelling approvals over the preceding 12 months, plotted monthly. Source: ABS Building Approvals.
Raw approval counts flatter the big councils — a Stirling or a Cockburn has hundreds of thousands of residents, so it will always show large numbers. The more revealing measure is intensity: how many new homes a council is approving relative to the people already living there. On that score the outer-fringe councils pull sharply ahead.
Approvals per 1,000 residents (2021 Census population). A settled inner council typically runs low single digits; the fringe runs several times higher.
The gap is stark. Wanneroo is approving about 25 homes for every 1,000 residents a year — against roughly 8 in a settled middle-ring council like Stirling. That’s the difference between a suburb filling in and a frontier being built from scratch.
The engine underneath it is classic Western Australia: a resources economy pulling in workers, a steady drumbeat of interstate and overseas migration and — unlike hemmed-in Sydney — plenty of flat, cheap land to throw houses at. The result is a city expanding outward at both ends, north through Wanneroo and south towards Mandurah.
Thinking about buying into one of these new estates? New growth areas come with their own questions — bushfire mapping, zoning, which schools you’re actually zoned for. Check any of it on the development leaderboard or by searching a specific address.